Silver breaks downtrend, holds $75; RSI flags overbought

Silver (XAG/USD) broke a multi-month descending trendline, trades above the 200-day moving average and holds $75 support; RSI on several timeframes shows overbought readings.
On April 14, 2026, silver (XAG/USD) cleared a multi-month descending trendline and is trading above its 200-day moving average while holding the $75 support level. Momentum indicators on multiple timeframes show elevated RSI readings. A daily close above $77 is required to confirm the breakout; a drop below $74 would reopen downside risk toward $70.
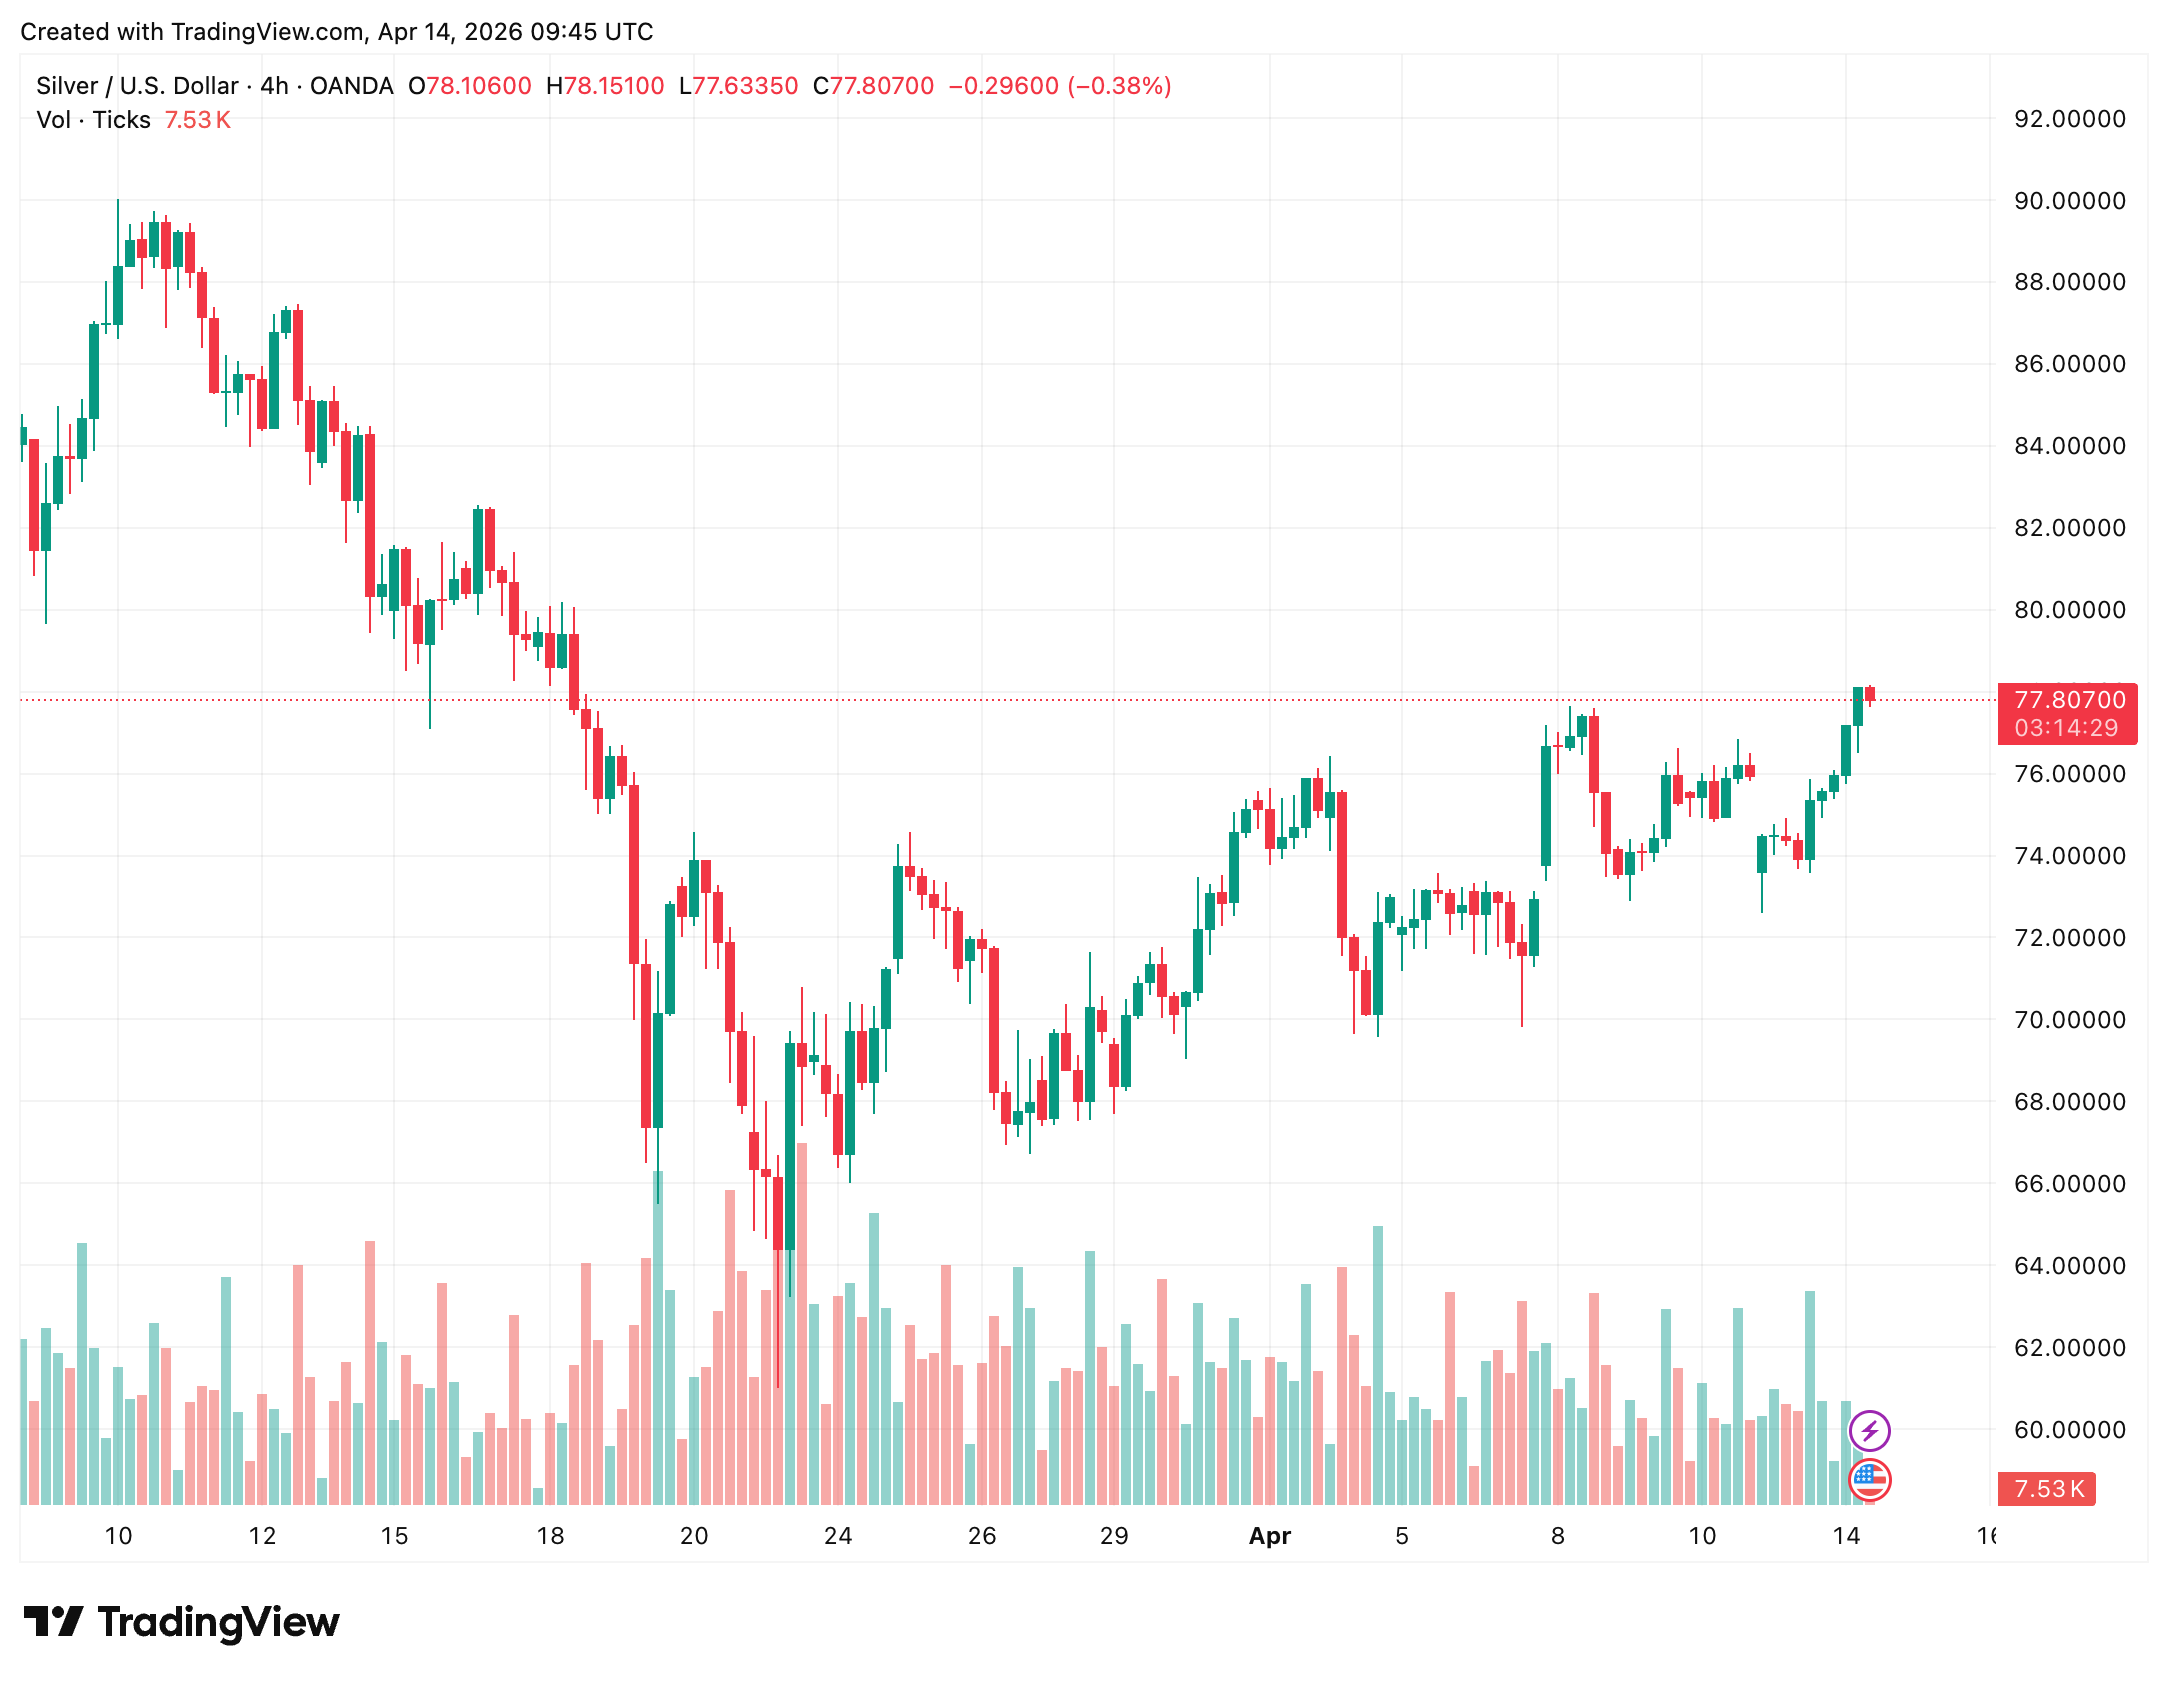
On the daily chart, the decline that began at late-January highs is being tested by current price action. Silver sits above the 200-day moving average but remains below the 100-day moving average. The $75 area, which acted as resistance earlier in the year, now serves as near-term support. The next psychological target for buyers is $80, with a technical resistance band near $82.16.
The four-hour chart shows higher highs and higher lows and a clear break above the $75 horizontal level. Price on that timeframe is holding above dynamic support near the 100-day moving average. The 200-day moving average on the H4 is around $78.46; a move above that level would place $80 in clearer view. The H4 RSI is near 59.6, indicating room for further upside before reaching extreme overbought territory on that timeframe.
On the one-hour chart, the market has been grinding higher with short-term moving averages guiding purchases. Immediate intraday support sits near $75.35, and $78 is the nearer target before $80. The H1 RSI shows signs of divergence and short-term exhaustion while price makes higher highs, which may lead to a pullback toward the $75.00–$75.50 area.
Failure to hold the $75 support and a return beneath the descending trendline, especially a move below $74, would invalidate the current breakout scenario and raise the possibility of a retest of the $70 support zone. Oscillators are stretched on several timeframes, and market participants note that a confirmed daily close above $77 and defendable support near $75 would offer clearer technical confirmation.
The price references and technical observations are drawn from OANDA Global Markets Ltd market data and MarketPulse technical commentary dated April 14, 2026, with analysis from OANDA MarketPulse analyst Zain Vawda.
The content on The Coinomist is for informational purposes only and should not be interpreted as financial advice. While we strive to provide accurate and up-to-date information, we do not guarantee the accuracy, completeness, or reliability of any content. Neither we accept liability for any errors or omissions in the information provided or for any financial losses incurred as a result of relying on this information. Actions based on this content are at your own risk. Always do your own research and consult a professional. See our Terms, Privacy Policy, and Disclaimers for more details.
Articles by this author