Gold nears $4,601 as oil jumps and US-Iran concerns grow

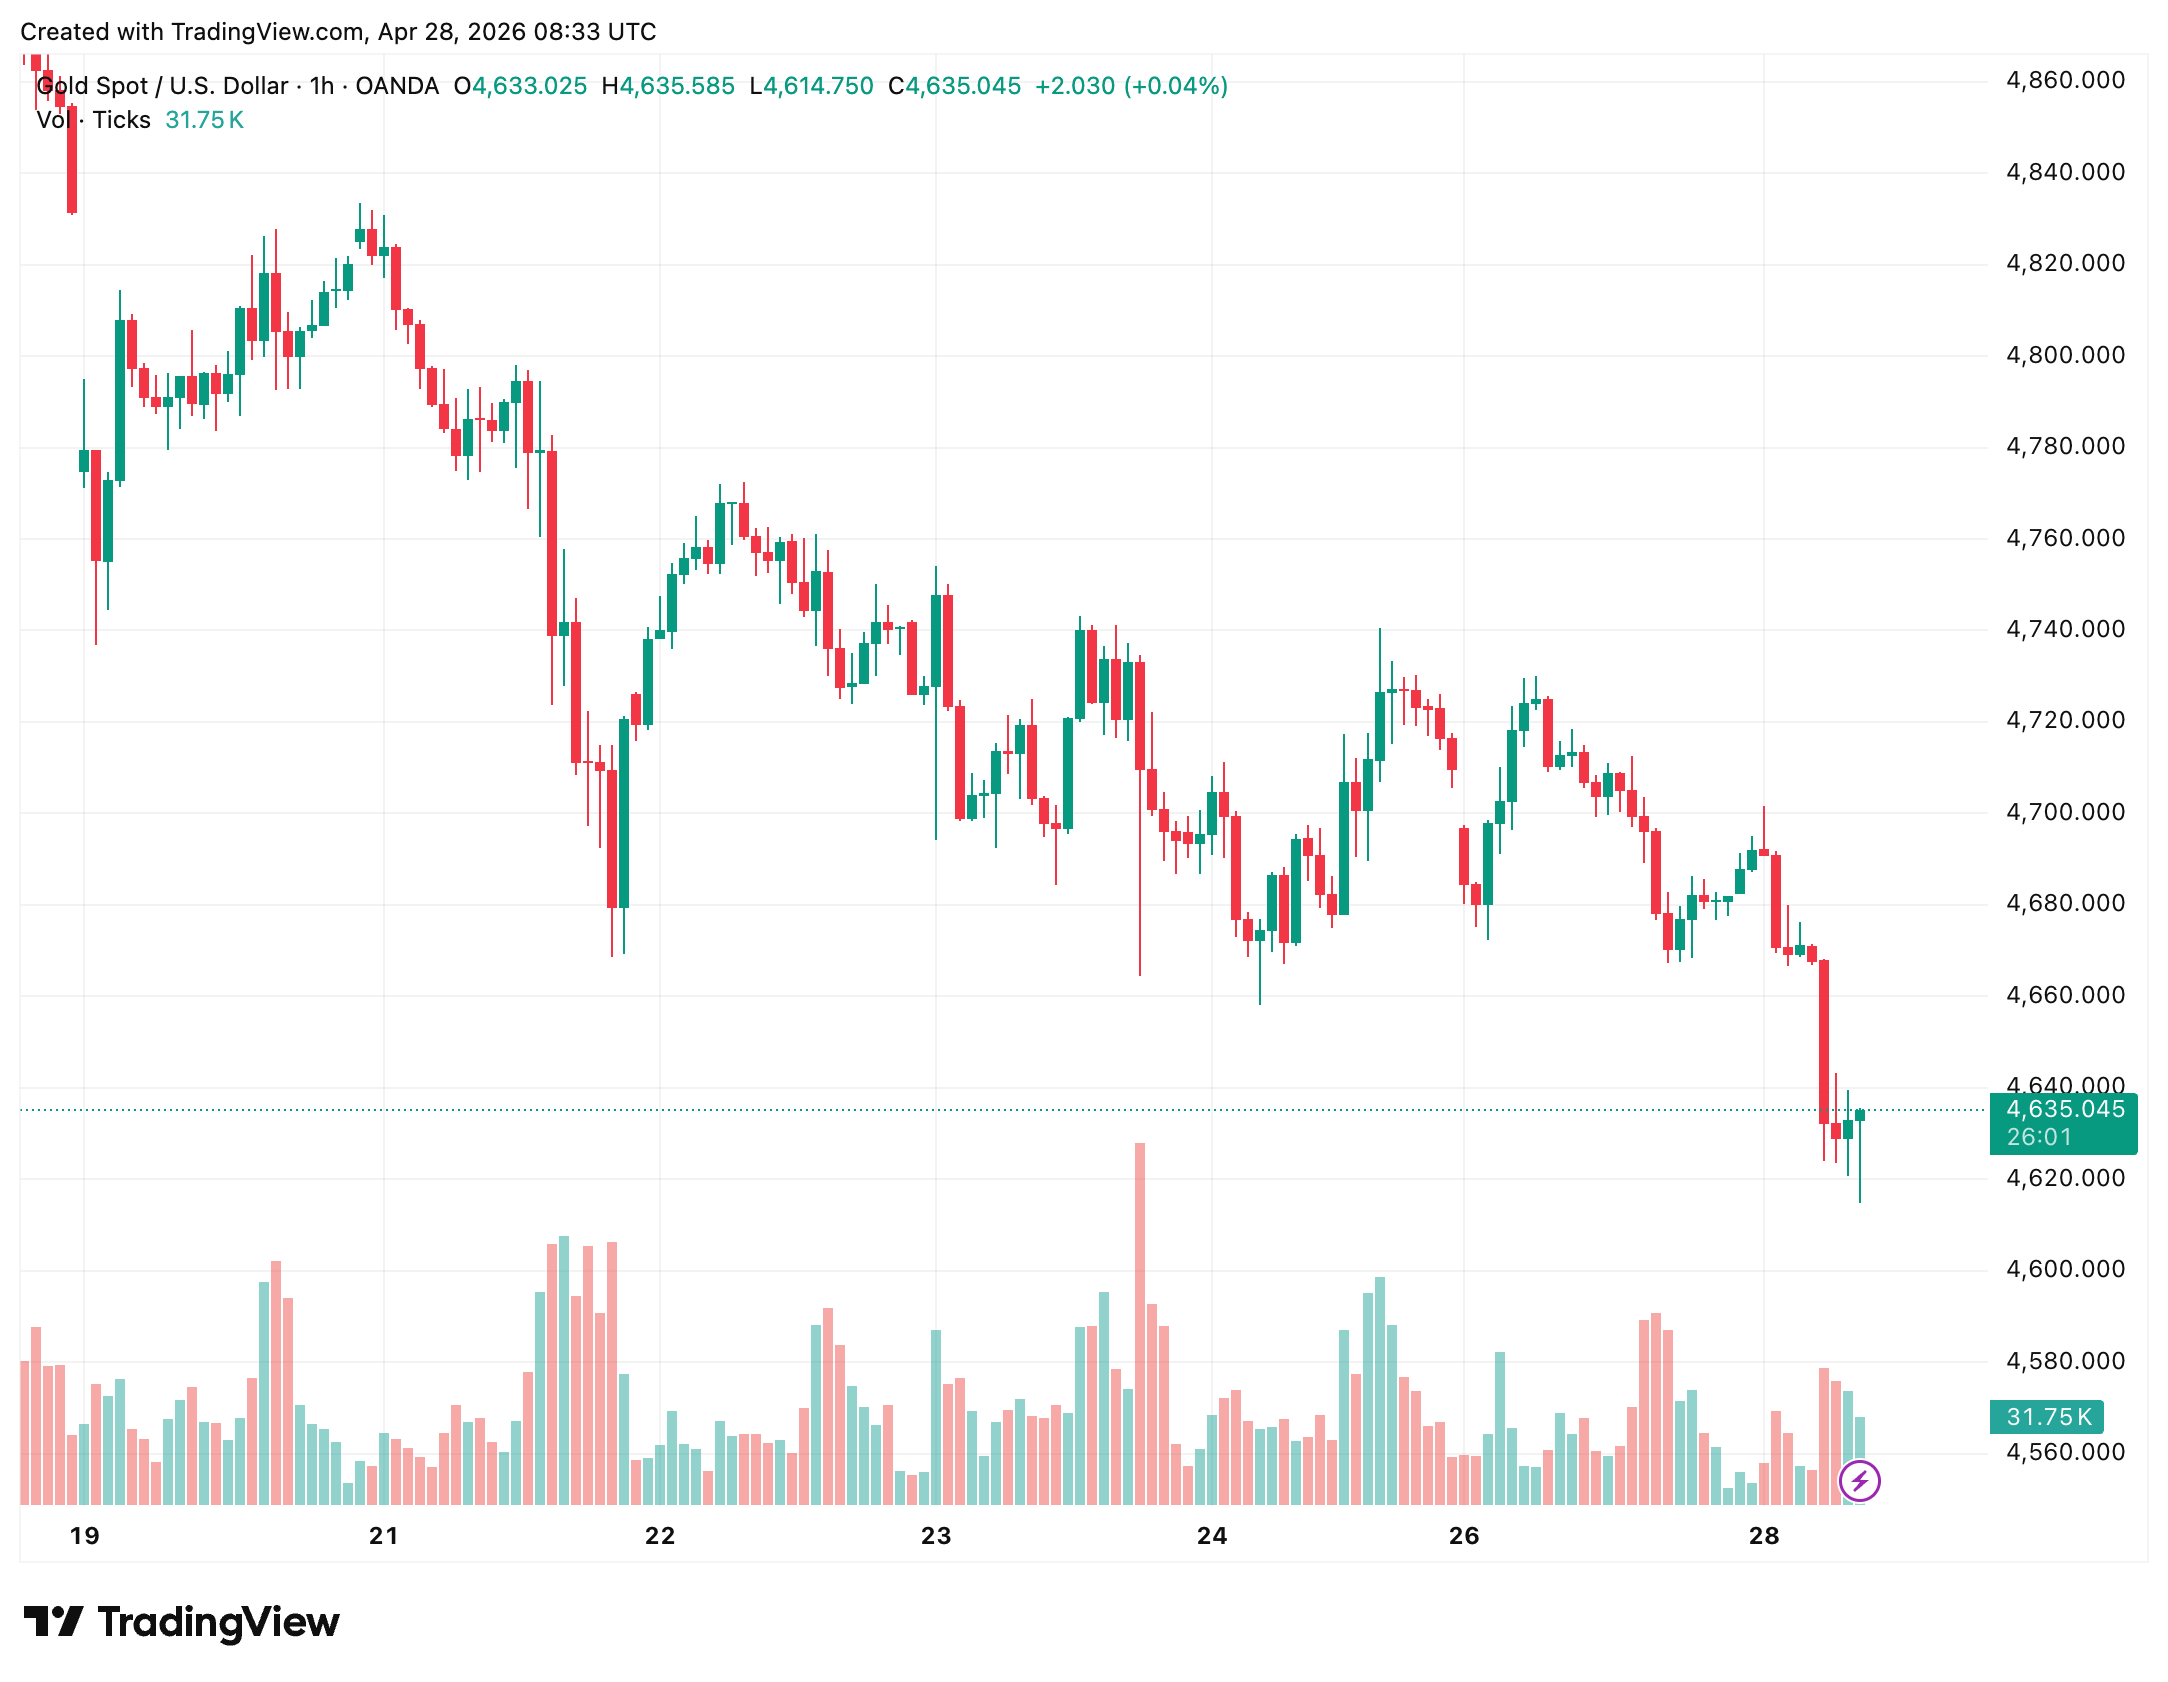
Gold fell toward $4,601 on April 28, 2026, after oil rose and doubts about a US‑Iran settlement reduced demand; prices slipped below H4 100- and 200-period moving averages.
Gold (XAU/USD) fell and approached the $4,601 support level on April 28, 2026, after an early Asian-session rise in oil and renewed uncertainty over a possible US‑Iran settlement. Price data are top-of-book quotes from OANDA Global Markets Ltd.
Oil gained in the Asian session, increasing concerns about inflation that weighed on demand for gold as a safe haven. Market participants also reacted to reports that President Trump expressed dissatisfaction with a recent proposal from Iran, renewing uncertainty about the diplomatic outlook.
On the four-hour chart, prices moved below both the 100-period and 200-period moving averages, accelerating the decline. The four-hour relative strength index registered near 23, in oversold territory, indicating strong selling momentum on that timeframe.
Earlier in the week, gold failed to hold above the $4,800 area and was rejected near the $4,700 psychological level before the current leg lower. After the rejection, the market broke through several intraday supports.
The one-hour chart showed a sequence of lower highs and lower lows. Recent aggressive selling pushed the price toward the $4,620 area, cutting through short-term support zones and leaving a gap between the current price and short-term moving averages. The one-hour RSI did not display a bullish divergence.
On the 15-minute chart, traders were watching for short-term triggers. In a bearish scenario, failure to reclaim the $4,640–$4,650 zone during any relief rally and a break below the recent swing low near $4,620 would likely open the path to the $4,601 target. A short-term trigger would be a rejection at the 15-minute 50-period moving average or a decisive drop below $4,620.
A bullish intraday reversal would require a push above $4,650 and a 15-minute close above $4,655 with the 15-minute RSI moving above 50. That outcome could lead to a rally toward the $4,680–$4,700 band.
Analysts highlighted intraday levels of resistance at $4,650, $4,687 and $4,700, and support at $4,620, $4,601 and $4,580. Price references are from OANDA top-of-book quotes.
OANDA market analyst Zain Vawda advised caution, saying he would remain on the sidelines until the one-hour structure produced a higher high, and noted that market positioning could change quickly if official comments altered perceptions about a US‑Iran settlement.
Longer-term charts had shown upward movement over recent months, but the break below the H4 moving averages represented a setback for near-term bulls. Traders and risk managers continued to monitor oil and geopolitical developments for factors that could change price direction.
The content on The Coinomist is for informational purposes only and should not be interpreted as financial advice. While we strive to provide accurate and up-to-date information, we do not guarantee the accuracy, completeness, or reliability of any content. Neither we accept liability for any errors or omissions in the information provided or for any financial losses incurred as a result of relying on this information. Actions based on this content are at your own risk. Always do your own research and consult a professional. See our Terms, Privacy Policy, and Disclaimers for more details.
Articles by this author