What Is Going on with Dogecoin and Why the Price Is Falling

Why is Dogecoin dropping? DOGE fell 2.07% on August 6 amid institutional selling, technical pressure, and macroeconomic caution.
Key Points:
- Trading volume spiked to 878 million DOGE amid large-scale institutional selling.
- Broader macroeconomic risk-off sentiment pressured speculative assets like DOGE.
- Technical indicators broke down, with DOGE falling below key support and momentum turning negative.
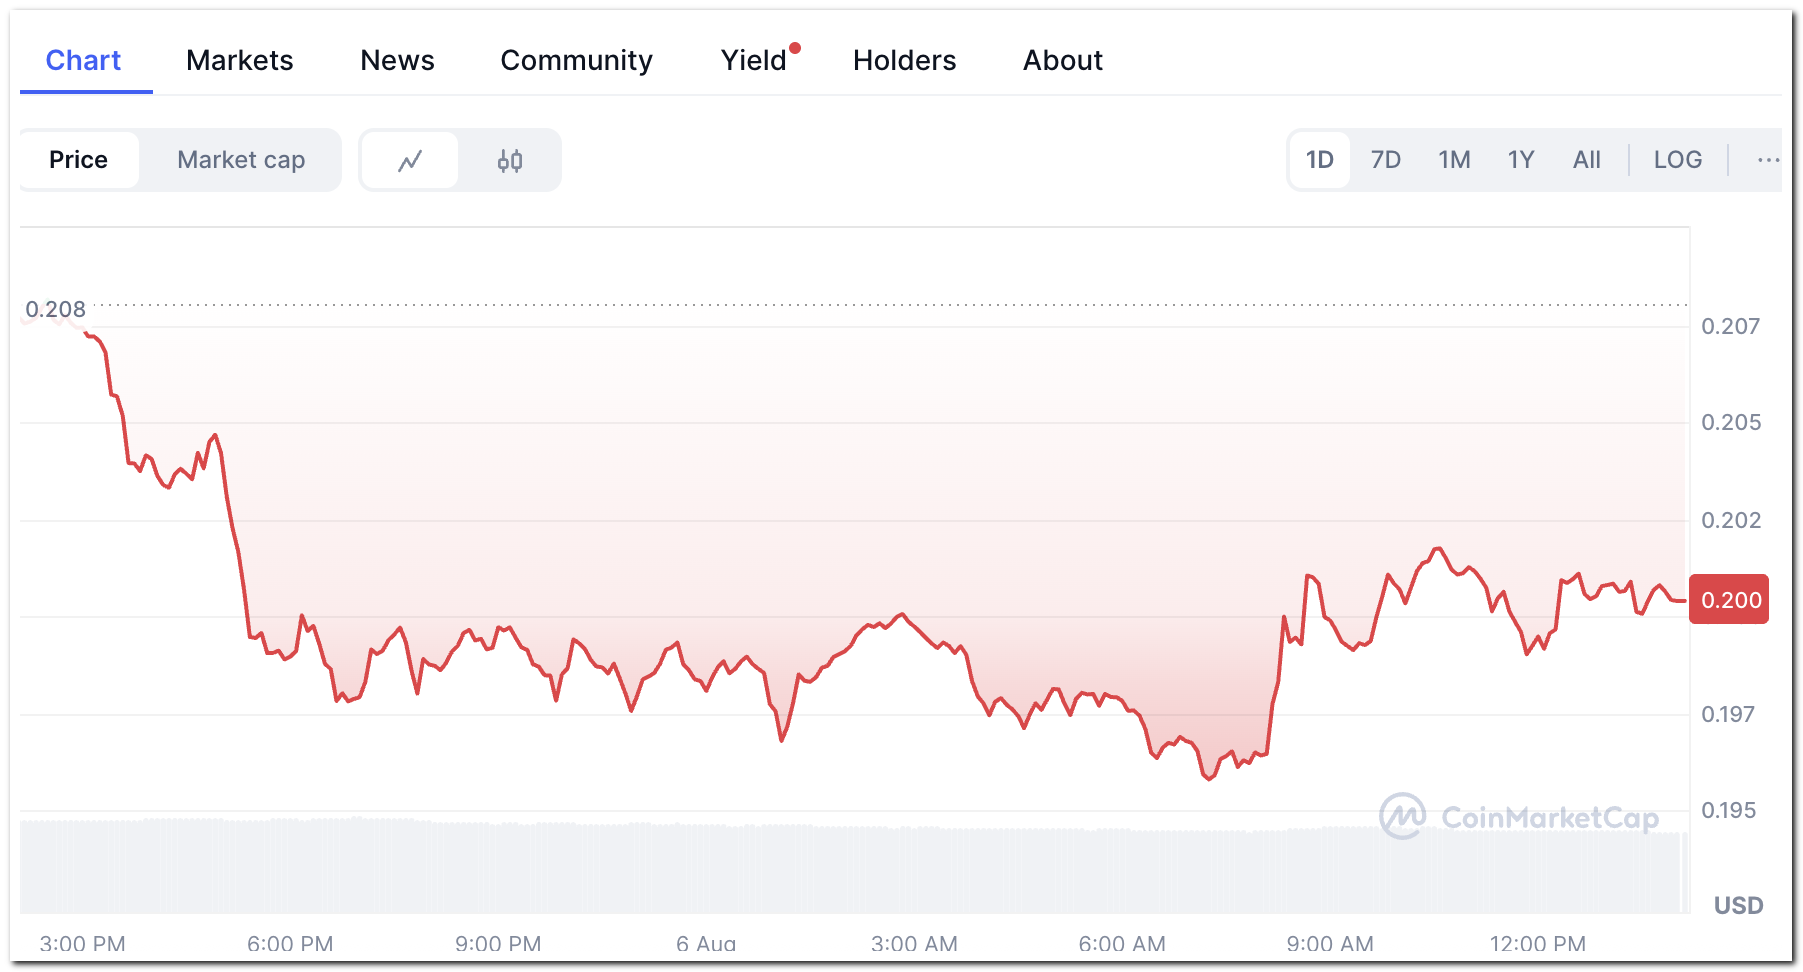
Dogecoin declined on August 6, 2025. As of this writing, the price stood at $0.2004, down 2.07% over 24 hours. The day’s opening was approximately $0.2074. The price dipped to an intraday low of around $0.196. The chart shows a downward trajectory beginning late August 5 and continuing through August 6, with brief, limited rebounds. This Dogecoin crash reflects several concurrent market dynamics.
Trading Volume Spike and Institutional Selling
One factor explaining why is Dogecoin dropping is the sharp increase in trading volume, which reached about 878 million DOGE in 24 hours. According to CoinDesk, this spike reflects large-scale selling by institutional holders. DOGE broke below the $0.205 support level, triggering additional downside as sell orders accumulated.
Broader Market Caution
Another relevant development in assessing what happened to doge coin is the broader risk-off sentiment. Market sentiment shifted amid geopolitical tensions and signals from the U.S. Federal Reserve that interest rates will remain elevated. Appetite for speculative assets weakened. DOGE, as a high-volatility asset, was directly affected.
Technical Breakdown
Technical signals help clarify why is doge dropping. According to FXLeaders and Blockonomi, DOGE fell below its 20-day moving average, with RSI readings confirming downward momentum. The breakdown of the $0.205 level exposed the $0.198–$0.185 range. Despite a prior golden cross on the 200-day moving average, near-term indicators remain negative. Whales reportedly accumulated over 1 billion DOGE during this period, but this has not yet shifted the short-term trend.
If the current pressure on support levels continues, further downside toward $0.185 remains likely. Short-term recovery will depend on a shift in broader risk sentiment and whether buyer activity strengthens at key thresholds.
The content on The Coinomist is for informational purposes only and should not be interpreted as financial advice. While we strive to provide accurate and up-to-date information, we do not guarantee the accuracy, completeness, or reliability of any content. Neither we accept liability for any errors or omissions in the information provided or for any financial losses incurred as a result of relying on this information. Actions based on this content are at your own risk. Always do your own research and consult a professional. See our Terms, Privacy Policy, and Disclaimers for more details.
Articles by this author


