Weekly Analysis of BTC, ETH, and the Stock Market (Feb 10, 2025)

An overview of BTC, ETH, XAUT, and S&P500 charts, and the current cryptocurrency market dynamics.
Bitcoin (BTC)
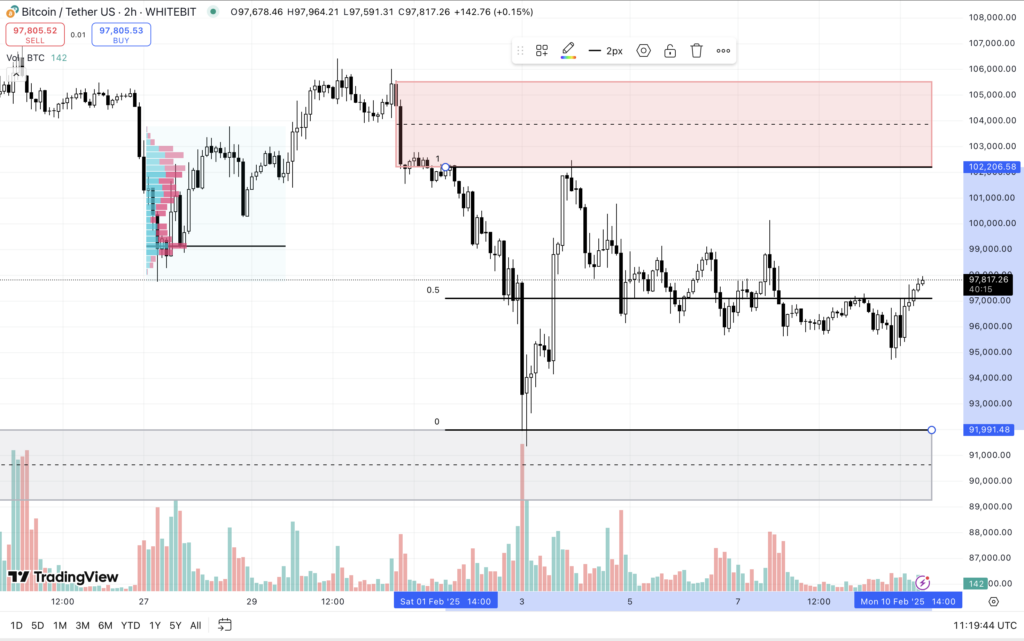
Bitcoin has yet to fully recover from its early February drop. The leading cryptocurrency remains range-bound, trading between $92,000 support and $102,200 resistance. This price movement highlights a key contrast between digital and physical gold—while an ounce of gold trades at a relatively modest $3,000, Bitcoin fluctuates within a $10,000 price corridor.
BTC’s future direction remains uncertain. If buyers gain strength and push the price above $100,000, Bitcoin could test new highs in the $102,200–$105,500 range, potentially extending its upward trend.
However, a deeper correction could trigger a retest of the $92,000 support level, which would likely lead to a new local low within the $89,200–$92,000 range.
Ethereum (ETH)
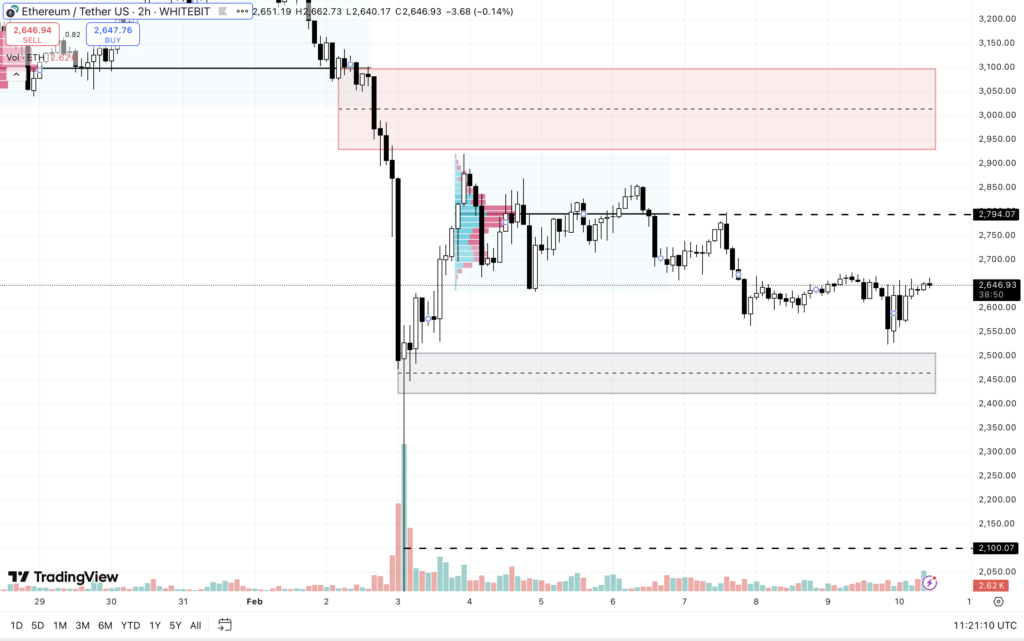
Ethereum’s price remains in a state of uncertainty, with the second-largest cryptocurrency trading within a sideways range between $2,420–$2,500 support and $2,930–$3,100 resistance.
A key level to watch is $2,794, a critical resistance zone that buyers must break through to push higher. However, given the overall market uncertainty, a return to an uptrend appears unlikely in the near term.
The most probable scenario for ETH is a new local low, especially if Bitcoin experiences a technical correction. In this case, Ethereum could drop to $2,100 as early as February.
S&P 500 (SPX)
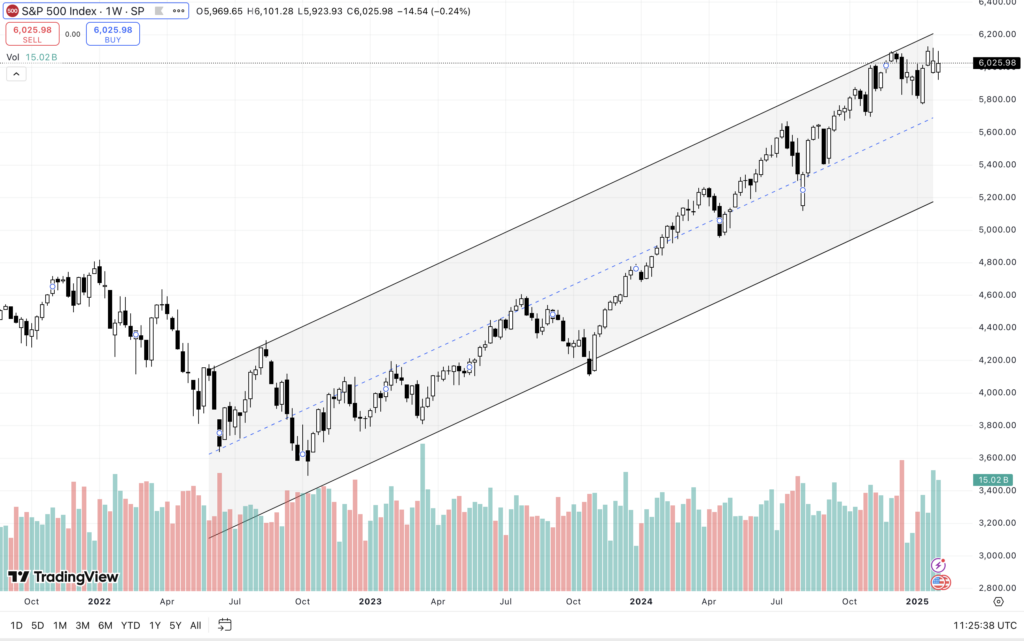
Last week, the S&P 500 initially saw a decline, but strong buying activity quickly absorbed the dip, pushing the index back above $6,000.
As the U.S. stock market prepares to open, rising geopolitical tensions and new trade restrictions could lead to another corrective move. If a pullback occurs, buyers may view the $5,700–$5,900 range as an opportunity to increase their long positions.
Despite short-term fluctuations, the overall uptrend remains intact, with the index continuing to move within its ascending channel, gradually setting new all-time highs.
Tether Gold (XAUT)
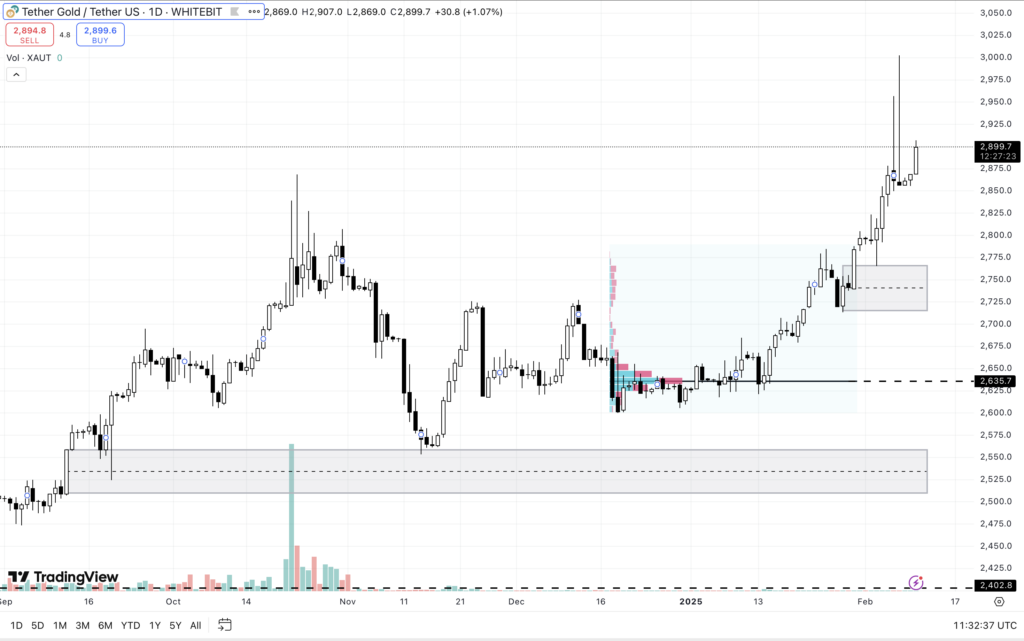
Gold’s rally remains strong, with the precious metal once again reaching a new all-time high last week. Tether Gold (XAUT) followed suit, setting a fresh ATH at $3,002.6.
There are no immediate signs of a reversal, suggesting that the uptrend is likely to continue. If momentum holds, the next ATH could surpass $3,050, assuming the stock market remains stable and long-term investors resist the temptation to take profits at the psychological $3,000 level.
If a short-term pullback occurs, long positions on XAUT could be considered. A potential correction may target the $2,715–$2,766 support zone, with further downside possible to $2,635 or the $2,510–$2,560 buy range.
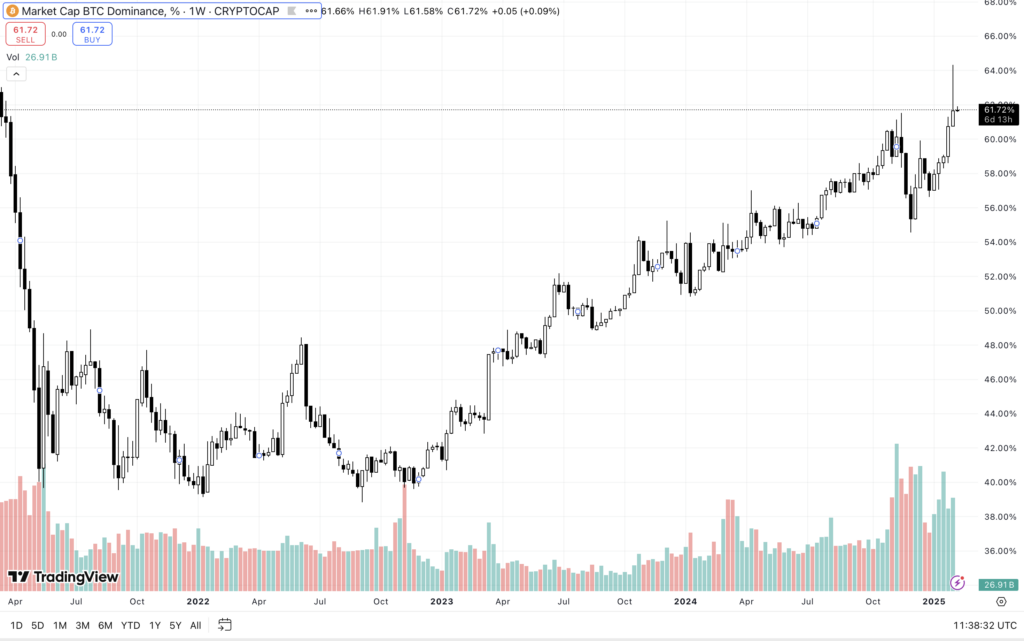
BTC Dominance, Altcoin Season Index, Fear and Greed Index
At the time of writing, Bitcoin dominance stands at 61.72%, continuing its steady rise. This trend is driven by Bitcoin’s ongoing correction, which has led to even steeper losses for altcoins.
If BTC fails to hold above $100,000, this pattern is unlikely to change in the near future.
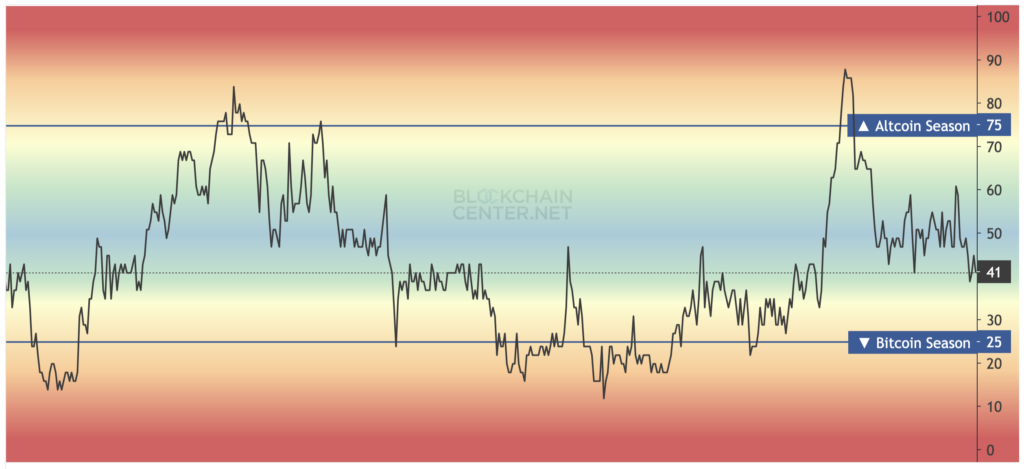
The Altseason Index currently sits at 41, indicating a lack of demand for altcoins. Investors are becoming increasingly skeptical of alternative cryptocurrencies, favoring Bitcoin as a safer option.
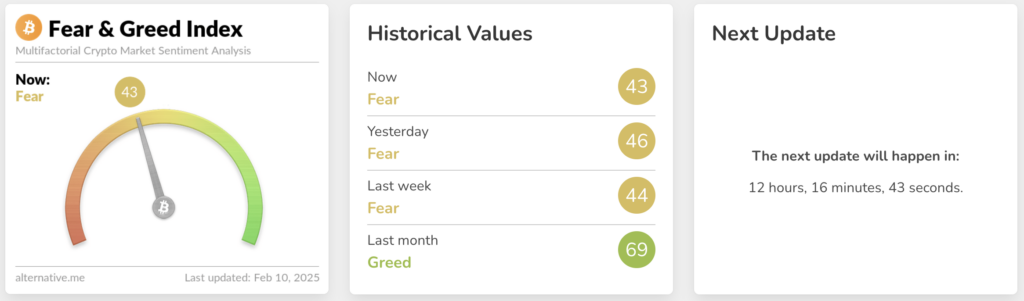
The Fear & Greed Index stands at 43, reflecting a market sentiment of “Fear”. This suggests that traders are gradually exiting long positions, perceiving cryptocurrency investments as increasingly risky. As a result, liquidity is flowing out of the digital asset market.
Key Economic Updates
This week brings several key macroeconomic updates that could impact financial markets:
- Tuesday, February 11 – Speech by Federal Reserve Chair Jerome Powell
- Wednesday, February 12 – Consumer Price Index (CPI) (a key inflation indicator in the U.S.) and Crude Oil Inventory Reports
- Thursday, February 13 – Initial Jobless Claims and the Producer Price Index (PPI)
- Friday, February 14 – Core Retail Sales and Total Retail Sales Data
The Consumer Price Index (CPI) is the most crucial release of the week, as it provides insight into U.S. inflation trends and consumer purchasing power. This data could significantly influence both the stock market and cryptocurrency prices, making it an important factor for traders and investors to watch closely.
Check out The Coinomist for the latest cryptocurrency rates and chart analysis.
Disclaimer
Please note that the analysis provided above should not be considered a trading recommendation. Before opening any deals, we strongly advise conducting your own research and analysis.
Abbreviations
TF (Timeframe) — a chronological period equal to the time it takes to form one Japanese candle on the chart.
Horizontal channel (flat, sideways, range) — the price movement between support and resistance levels, without going beyond the given range.
К — simplified designation of one thousand dollars of the asset price (for example, 23.4K – $23,400).
Gray range on the chart — a support zone.
Red range on the chart — a resistance zone.
Correlation — the tendency of prices of different cryptocurrencies to move in sync, often influenced by the dominance of one of the assets.
Initial materials
This analysis was informed by the following educational materials and articles from The Coinomist:
- TOP 5 Useful Chart Analysis Tools on TradingView
- How Are Trading Volumes Useful in Cryptocurrency Analysis?
- Candlestick Patterns: Types and How They Work in Trading
- The Most Popular Chart Patterns for Crypto Trading
The content on The Coinomist is for informational purposes only and should not be interpreted as financial advice. While we strive to provide accurate and up-to-date information, we do not guarantee the accuracy, completeness, or reliability of any content. Neither we accept liability for any errors or omissions in the information provided or for any financial losses incurred as a result of relying on this information. Actions based on this content are at your own risk. Always do your own research and consult a professional. See our Terms, Privacy Policy, and Disclaimers for more details.
Articles by this author