Bitcoin Retreats Toward $101,000 Amid Mounting Sell-Side Pressure

Bitcoin loses ground despite notable net inflows into spot ETFs, signaling a bearish short-term trend.
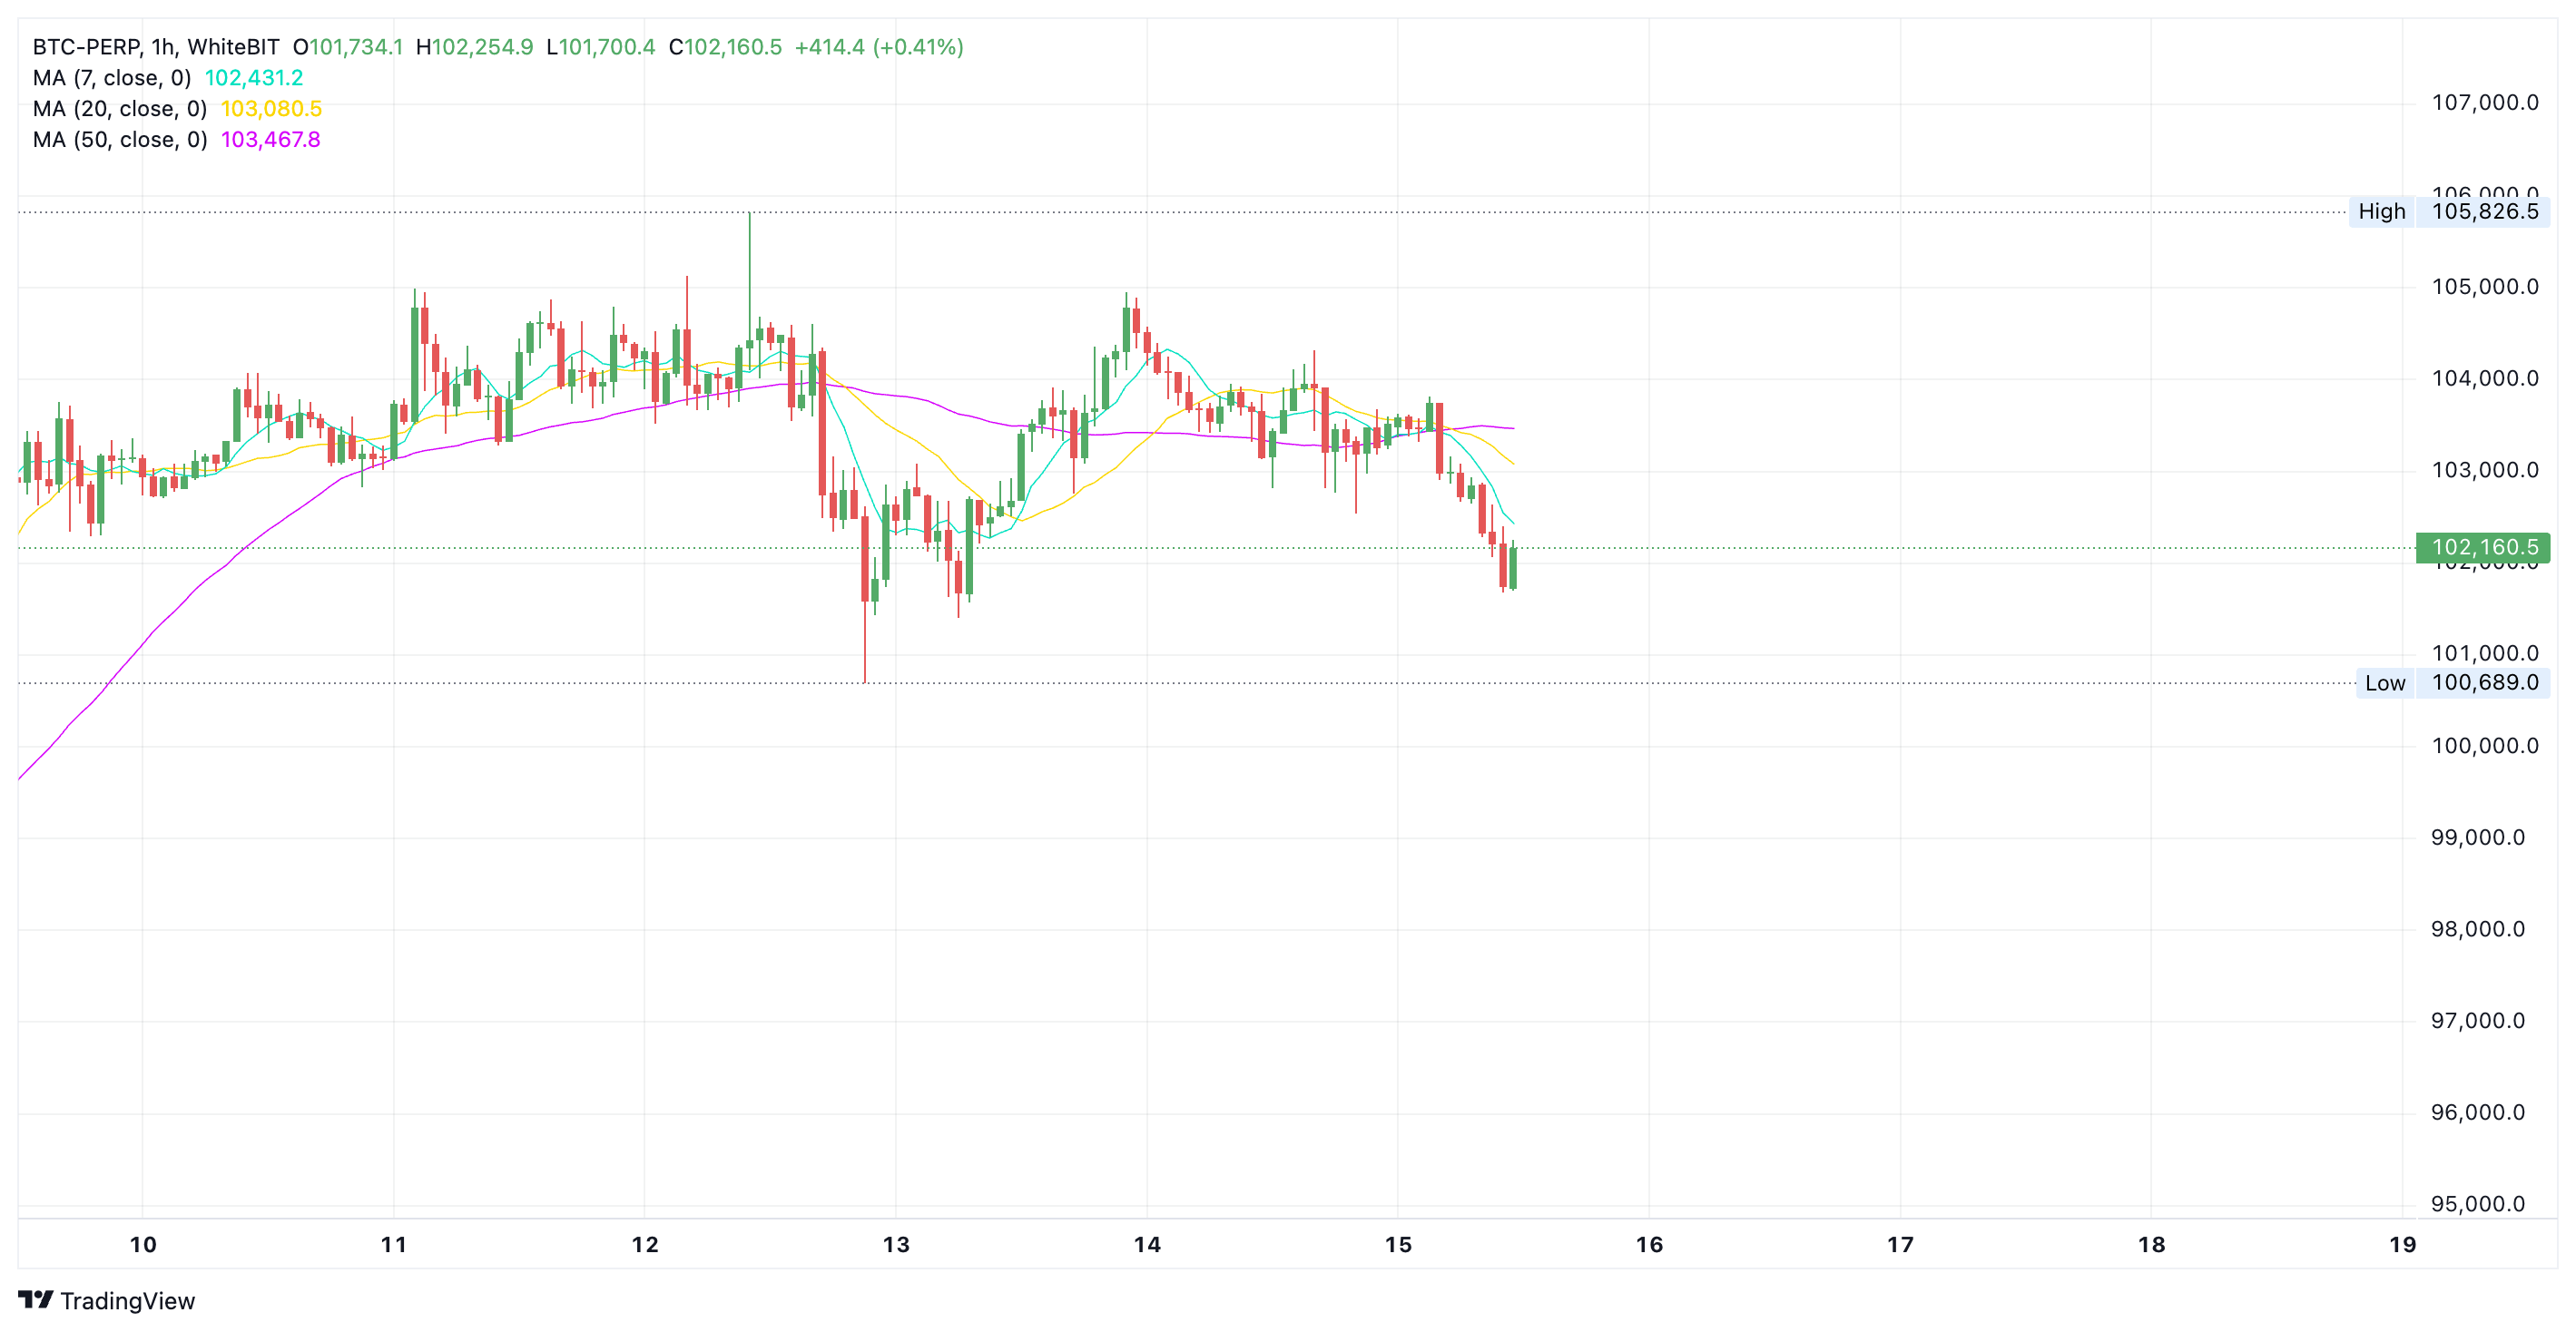
In the last 24 hours, Bitcoin has shed 1.6%, drawing closer to the $101K support threshold.
Spikes in trading activity and deepening doubts about a Federal Reserve rate cut continue to stir short-term volatility.
Bitcoin’s surge in volatility unleashed a chain reaction.
Altcoins dropped hard, triggering liquidations worth $378 million — with long positions alone making up $317 million of that figure.
For the second day running, Ethereum traders were hit hardest, surrendering over $85 million.
Even more striking: liquidations in illiquid altcoins surpassed those on Bitcoin.
Despite the turbulence, the crypto market hasn’t lost its optimism:
- Fear & Greed Index: still in “Greed” at 71
- BTC dominance: around 61.5%
- Altseason Index: back near Bitcoin season levels at 28
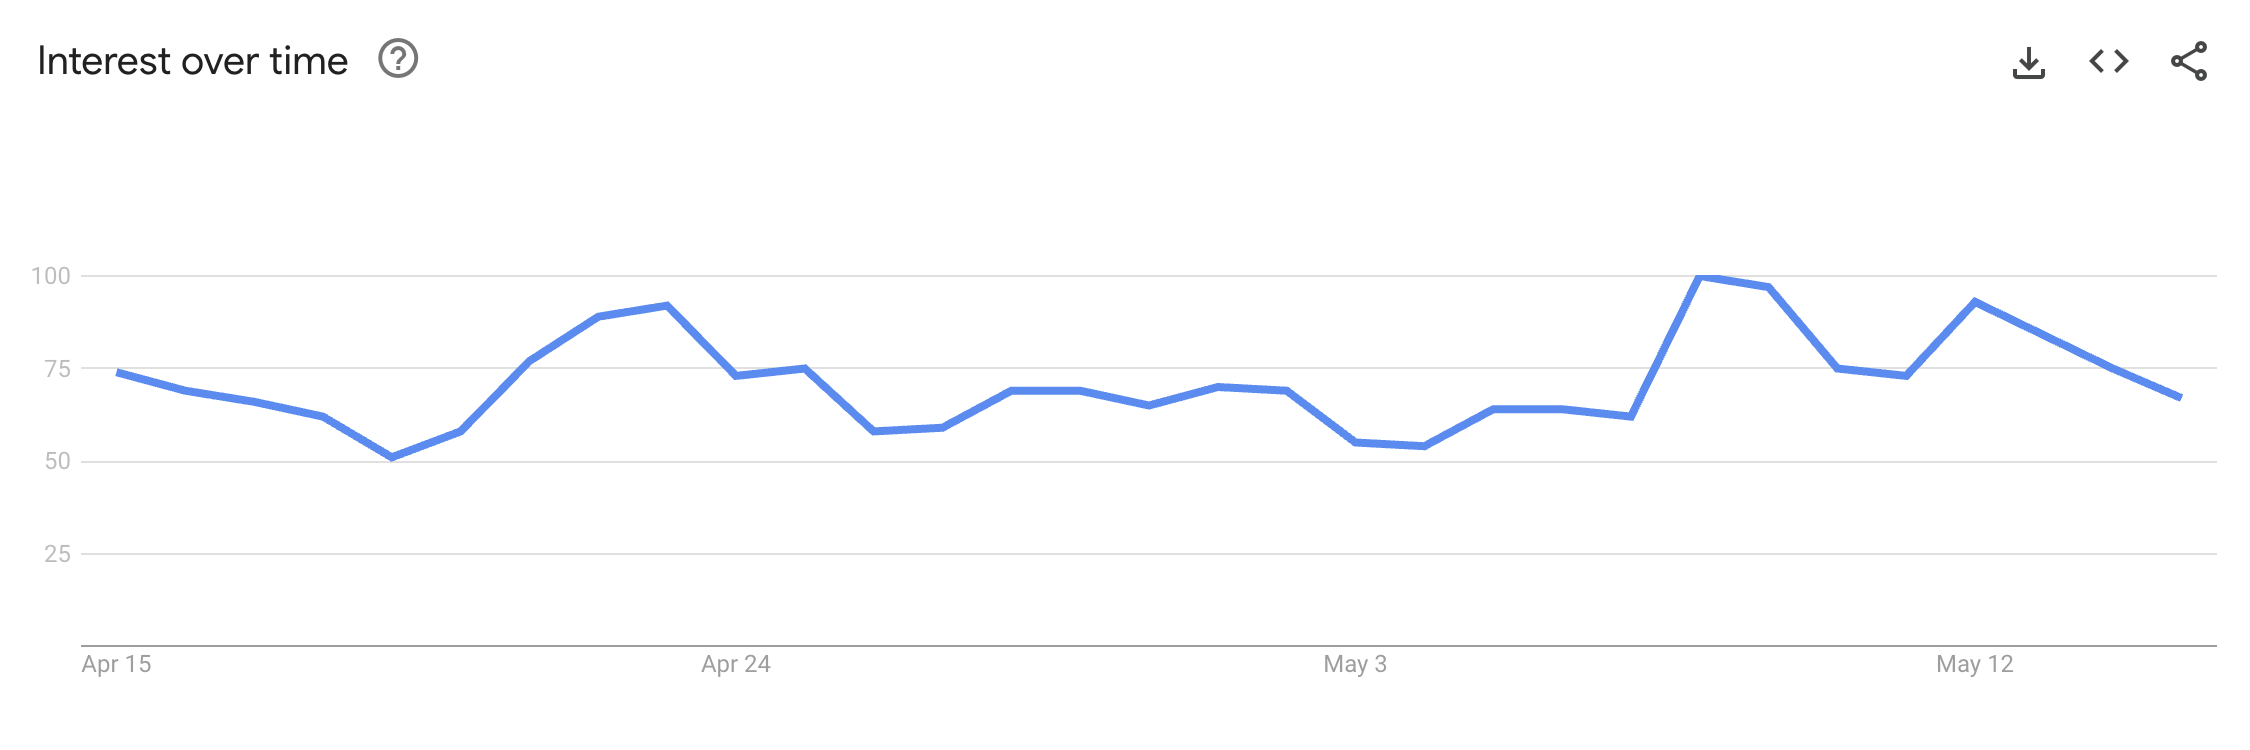
Bitcoin’s presence in global search trends has stalled. Over the past month, Google query data for BTC has remained flat, pointing to a sustained lull in public engagement.
Even high-impact developments — such as Coinbase being listed on the S&P 500 — have done little to change that.
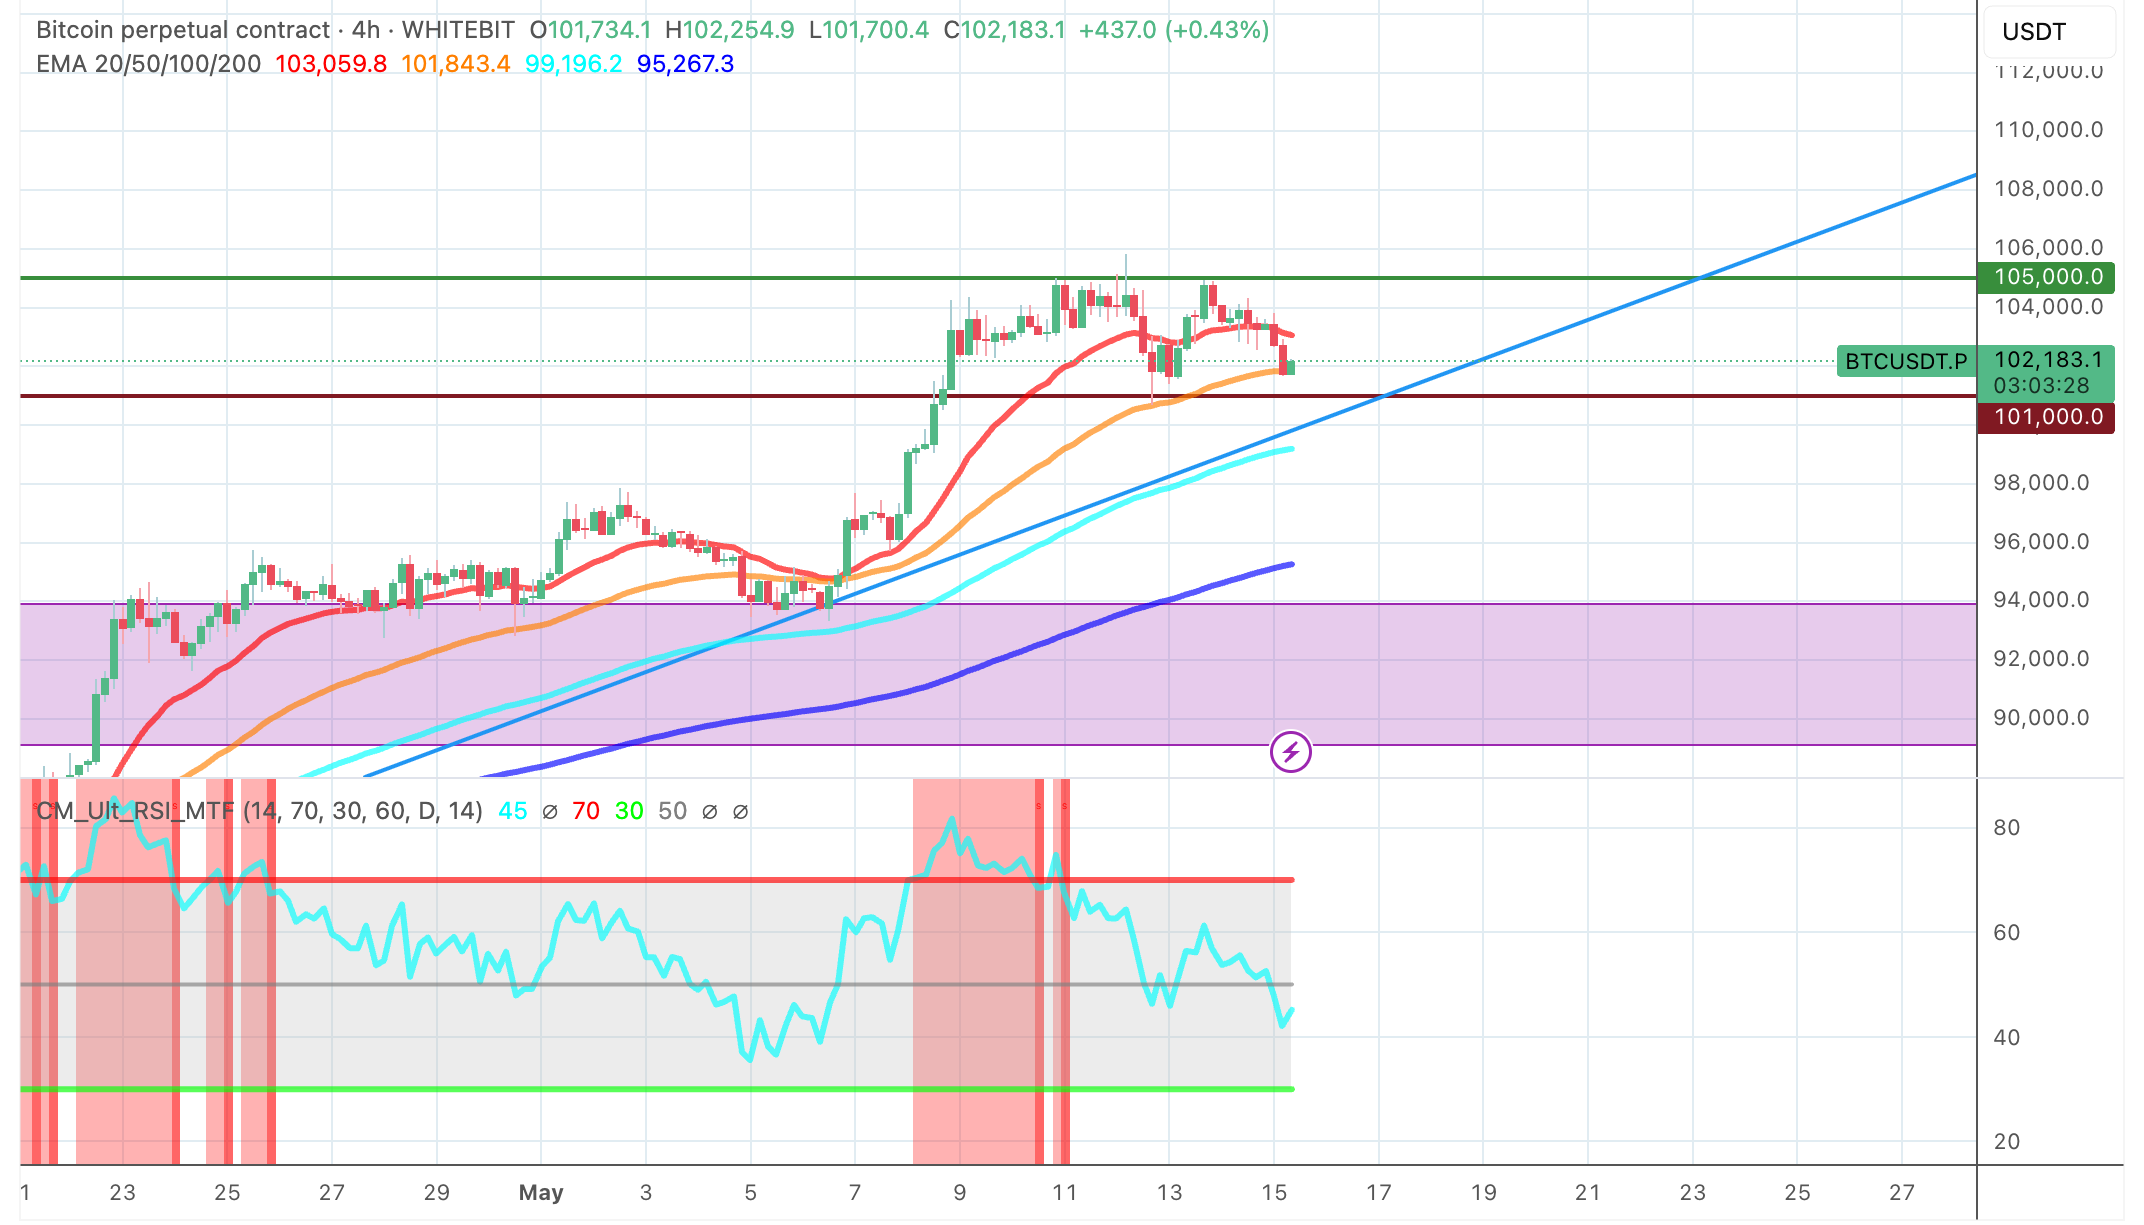
Bitcoin Testing the Bottom of Its Range
The price is edging toward the bottom of the $101K–$105K consolidation zone.
On the daily chart, Bitcoin has shed its overbought status. Yet on the shorter time frame, it remains elevated above the 200-day EMA.
This juxtaposition paints a picture of technical ambiguity.
Popular trader and analyst Phoenix believes Bitcoin will soon break through the $105,000 level and move well beyond its previous all-time high. He described the current and prior pullbacks as “a shakeout before the breakout” and urged traders to remain patient.
Key Market Drivers
Despite recent volatility, fundamentals for crypto remain solid:
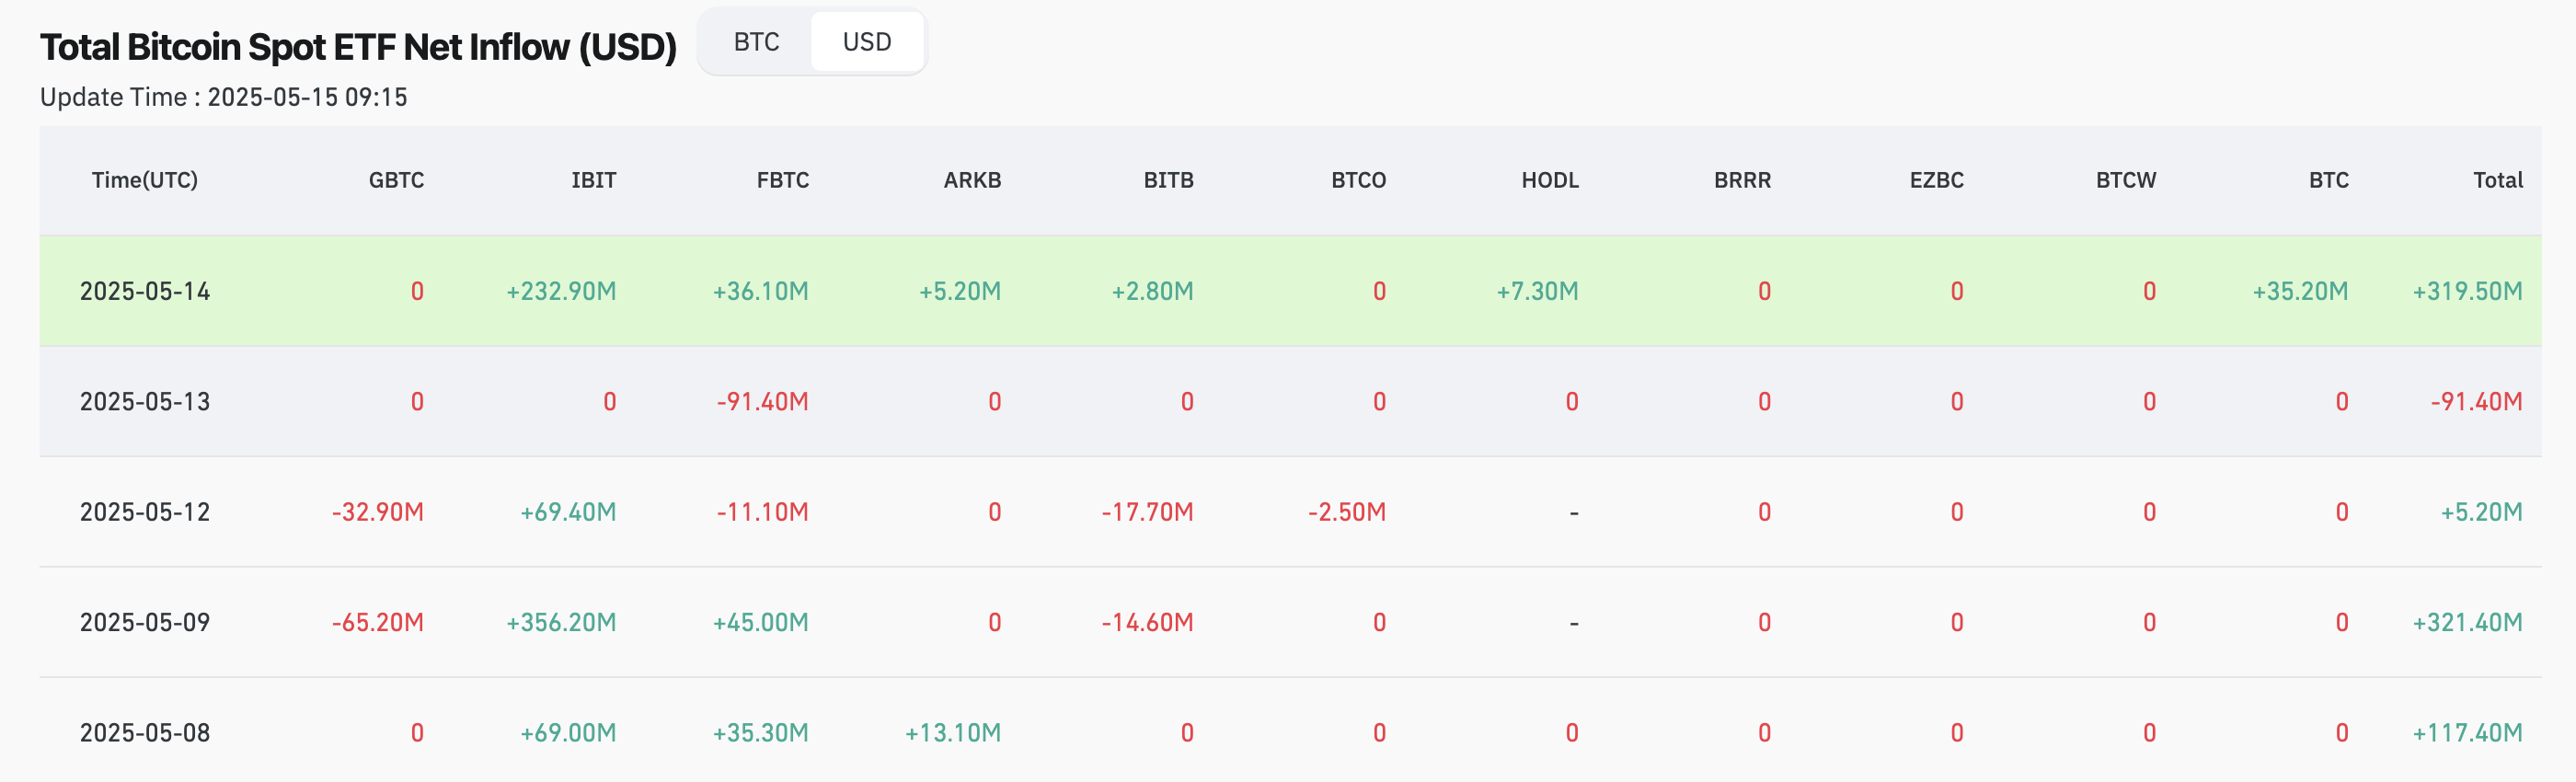
- On May 14, U.S. spot Bitcoin ETFs recorded $319.5 million in net inflows after a day of outflows.
- BlackRock’s iShares Bitcoin Trust (IBIT) topped the list with $232.9 million, resuming momentum after breaking a 20-day winning streak.
- Glassnode reports that Bitcoin’s push past $100K was fueled by intense spot-buying activity.
- QCP Capital says that after the inflation print, the market has shifted focus back to the Fed’s rate decision.
There’s only about an 8% chance the Fed will cut rates at its next meeting.
That marks a dramatic shift from early 2025, when investors were counting on four cuts. Now, they expect no more than two before the year is out.
The change in sentiment is weighing on risk assets — and Bitcoin is no exception.
Read on: Beyond Profits: Understanding the Spiritual Side of Trading
The content on The Coinomist is for informational purposes only and should not be interpreted as financial advice. While we strive to provide accurate and up-to-date information, we do not guarantee the accuracy, completeness, or reliability of any content. Neither we accept liability for any errors or omissions in the information provided or for any financial losses incurred as a result of relying on this information. Actions based on this content are at your own risk. Always do your own research and consult a professional. See our Terms, Privacy Policy, and Disclaimers for more details.
Articles by this author