Bitcoin near $63,500 after six-day rally; half supply at loss
Bitcoin rose to about $63,500 in early July after a six-day rally during thin summer liquidity. More than half of circulating supply remains at a loss, analysts note.
Bitcoin traded around $63,500 in early July after a six-day advance that followed June lows near $57,800. The rally occurred amid light summer liquidity and lifted prices back above $60,000.
Market participants are split between viewing the rise as a short-term relief rally and as a potential structural bottom. Trading desks cautioned that thin order books this season can amplify moves, complicating assessment of whether buying reflects durable demand.
Several trading firms pointed to a mix of factors behind the rebound. Softer macroeconomic data and a slightly more dovish tilt from the Federal Reserve coincided with easing geopolitical tensions and positive headlines for ether, contributing to a broader risk-on mood.
A U.S. payrolls report showing 57,000 jobs added versus a 110,000 consensus reduced market expectations for a year-end rate hike. Data also showed large wallets accumulated more than 270,000 BTC near the 200-week moving average, and options activity shifted from downside protection into $60,000–$70,000 calls.
Ether rose about 13.5% on the week and outperformed bitcoin over the same period. The rise followed an institutional product launch for ether on July 1; that launch came after staff and budget reductions at the related foundation and roughly $345 million of spot ether ETF outflows in the prior week.
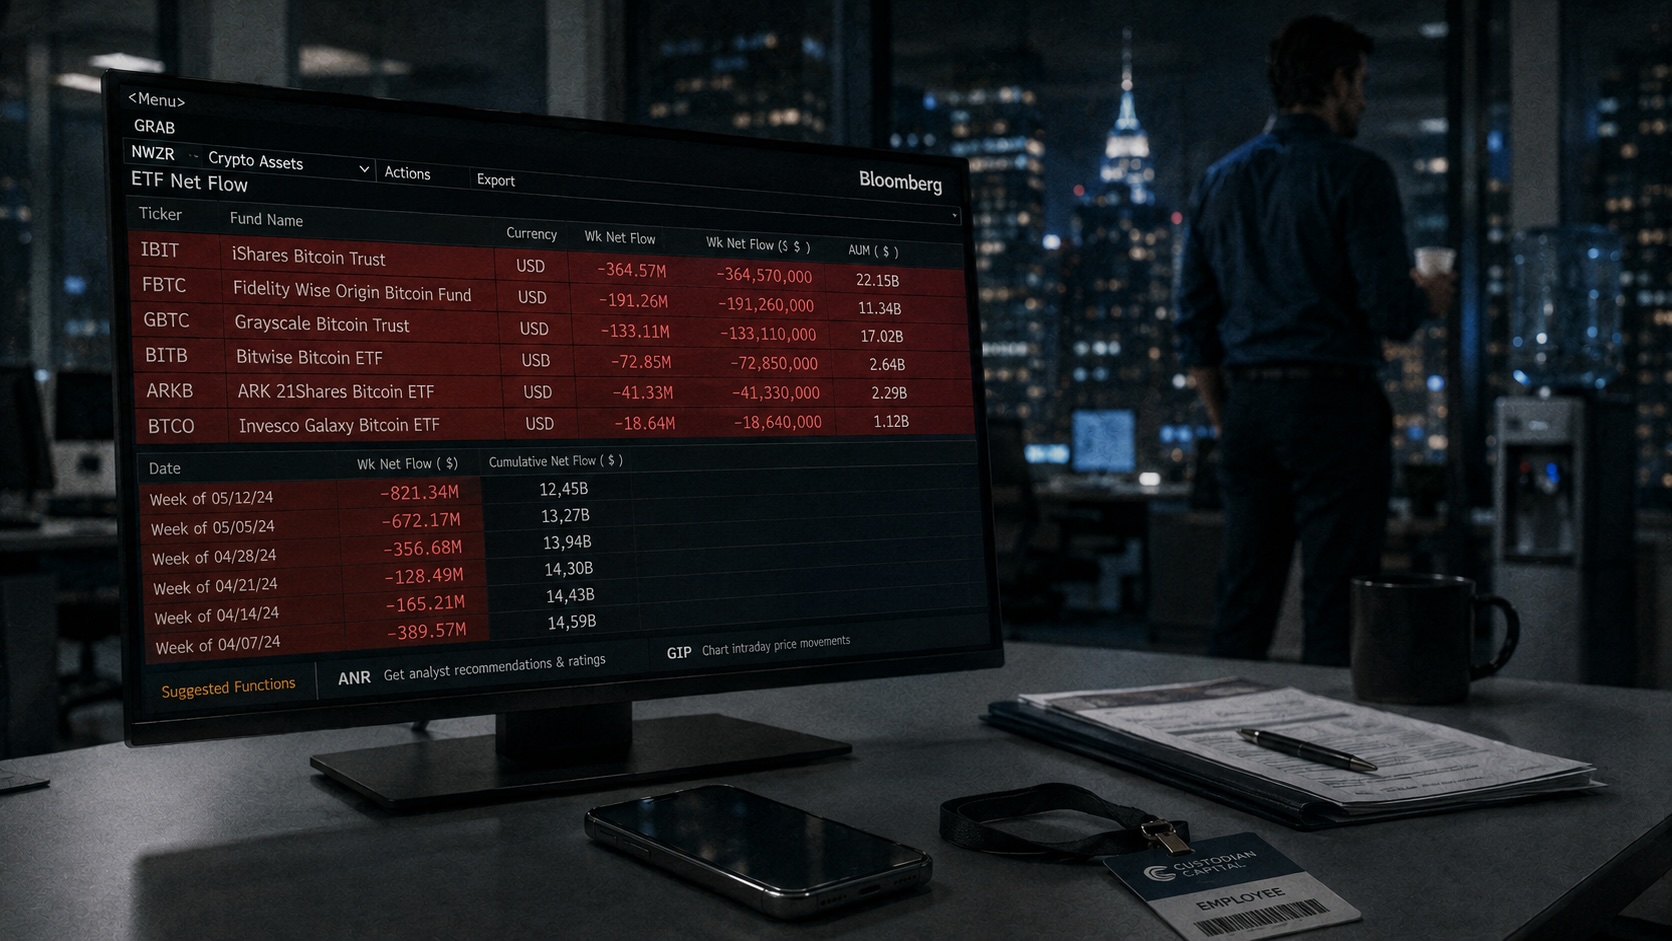
Spot bitcoin ETF flows were mixed. A $221.7 million inflow on July 2 ended a 10-day outflow run totaling about $2.73 billion, but year-to-date net outflows for spot bitcoin ETFs remained near $5.4 billion. Data for July 6 showed a net inflow of $266 million into U.S.-listed spot bitcoin funds, led by $209 million into a single large product; spot ether funds recorded about $20.7 million of inflows that day.
Exchange analysts said technical indicators suggested forced selling in June was easing. Bitcoin’s quick recovery above $60,000 within four trading sessions led some analysts to view the break under roughly $58,000 as a failed breakdown. “The sequence matters: spot demand emerged at a fresh marginal low before the macro-driven rally,” wrote analysts at a major exchange.
Longer-term on-chain data provided a contrasting signal. Research firm K33 reported that more than 50% of circulating bitcoin traded at a loss as of early June, a threshold first crossed on June 5. K33 noted that in prior instances when over half the supply was underwater, one-year forward returns varied widely and cycle bottoms arrived between 10 and 101 days after the crossover.
Other market indicators showed caution. The Coinbase Bitcoin Premium Index remained negative for a prolonged streak, and on-chain providers reported a rise in exchange deposits. Some sell-side analysts kept year-end targets unchanged, while others said sustained ETF inflows would be the clearest sign of renewed institutional demand.
The content on The Coinomist is for informational purposes only and should not be interpreted as financial advice. While we strive to provide accurate and up-to-date information, we do not guarantee the accuracy, completeness, or reliability of any content. Neither we accept liability for any errors or omissions in the information provided or for any financial losses incurred as a result of relying on this information. Actions based on this content are at your own risk. Always do your own research and consult a professional. See our Terms, Privacy Policy, and Disclaimers for more details.
Articles by this author